Cavitation is a widely known problem that occurs to pumps and results in significant damage and other undesirable consequences. To avoid damage a pump should be monitored for the formation and occurrence of cavitation. This article describes different options regarding cavitation monitoring and protection to fit any application.
Cavitation
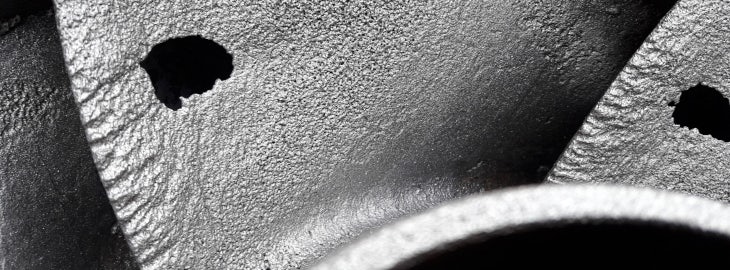
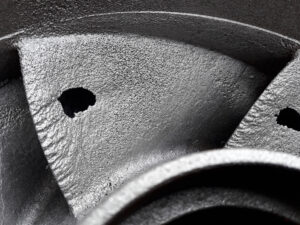
Cavitation is the formation of air bubbles inside a pump as a result of a pressure drop of the flowing liquid. As these air bubbles move, the pressure increases, resulting in the implosion of the air bubbles. The implosion of the air bubbles on the surface of the pump housing or impeller results in damage and performance issues. Two types of cavitation are distinguished:
- Suction cavitation can occur when a pump is under low pressure or high vacuum conditions. As the pump is not receiving enough flow, bubbles will form on the impeller. When these bubbles carry over to the other side (discharge) of the pump and are compressed with the liquid, they implode.
- Discharge cavitation can occur when the pressure during the discharge is excessively high. Due to the high pressure it becomes hard for the fluid to leave the pump, causing it to circulate inside the pump. This could cause a vacuum and the formation of air bubbles, which in turn causes damage to both the impeller and the pump housing.
Long-term cavitation leads to pumping failures, such as the destruction of the pump’s housing and impeller. Other effects of cavitation are excessive noise and energy usage.
Configurations to monitor cavitation
There are different configurations to be able to monitor cavitation. Which configuration fits the application best depends on the application and/or customer demands. Three configurations are distinguished:
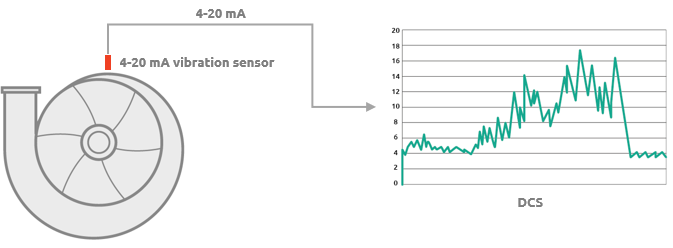
1. 4-20mA sensor
When using a 4-20mA sensor the customer is required to determine the desirable limit value and configure this in the DCS/PLC. The DCS/PLC is then used to generate an alarm when this limit value is exceeded. To determine the limit value a cavitation situation must be created in the pump. A large disadvantage of 4-20mA sensors is that it gives an overall value of the vibrations, making it impossible to distinguish cavitation from other factors that may cause excessive vibrations. A typical configuration when using a 4-20mA sensor looks as follows:
2. Programmable transmitter
As with the aforementioned configuration the cavitation test must be performed by the customer. The frequency at which cavitation occurs is determined and then used to filter the data. The desired alarm value is send to a DCS/PLC or used to trigger a relay. A standard 100mV/g accelerometer is used to send the raw vibration signal to the transmitter. The transmitter processes this signal and provides two 4-20mA signals that can be calculated over two different frequency bands. This makes it possible to distinguish between vibrations as a result of cavitation and those caused by other deviations such as unbalance and bearing damage. A typical configuration looks as follows:
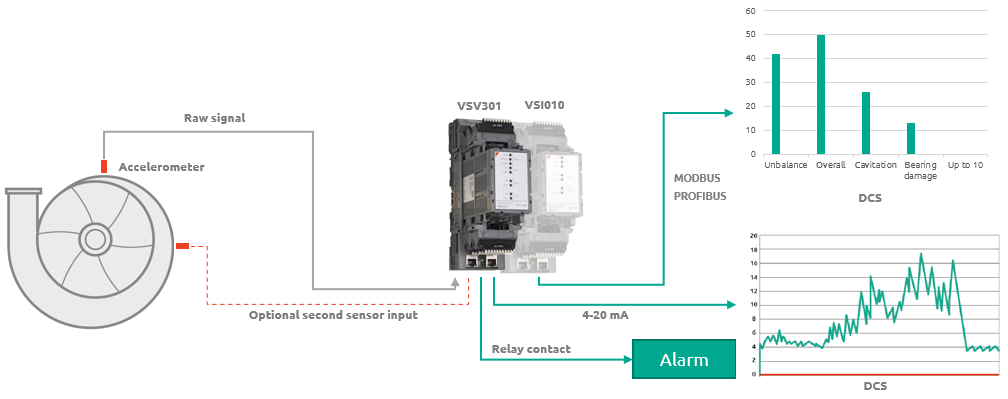
3. Condition monitoring transmitter (VibroSmart)
This configuration uses the same sensors as the transmitter configuration. Like the previous configuration, the 4-20mA signal is calculated within a freely configurable frequency. However, a more advanced type of transmitter is used. Through Modbus, up to 10 different calculated outputs per signal can be generated. This makes it possible to distinguish between specific machine errors in the control system. Some machine errors have a specific frequency range, which can be calculated independently. This makes it possible to directly attribute deviations in vibration behaviour to a specific error and immediately initiate the necessary action. Unfiltered data can be saved on a local PC or sent through a network, which enables remote condition monitoring.
Read about remote condition monitoring configurations here »
A typical configuration looks as follows: